VISITORS
288
+61.8%
vs previous period
WEBSITE ANALYTICS
Connect Google Analytics to Rankley and turn website traffic, engagement, pages, visitor sources, and behavior into a clearer view of what is working and what deserves attention.
Real data
Your connected Google Analytics data
Clear insights
See what is working and what needs attention
Know what to review
Focus on the signals that deserve a closer look
CONNECTED WEBSITE DATA
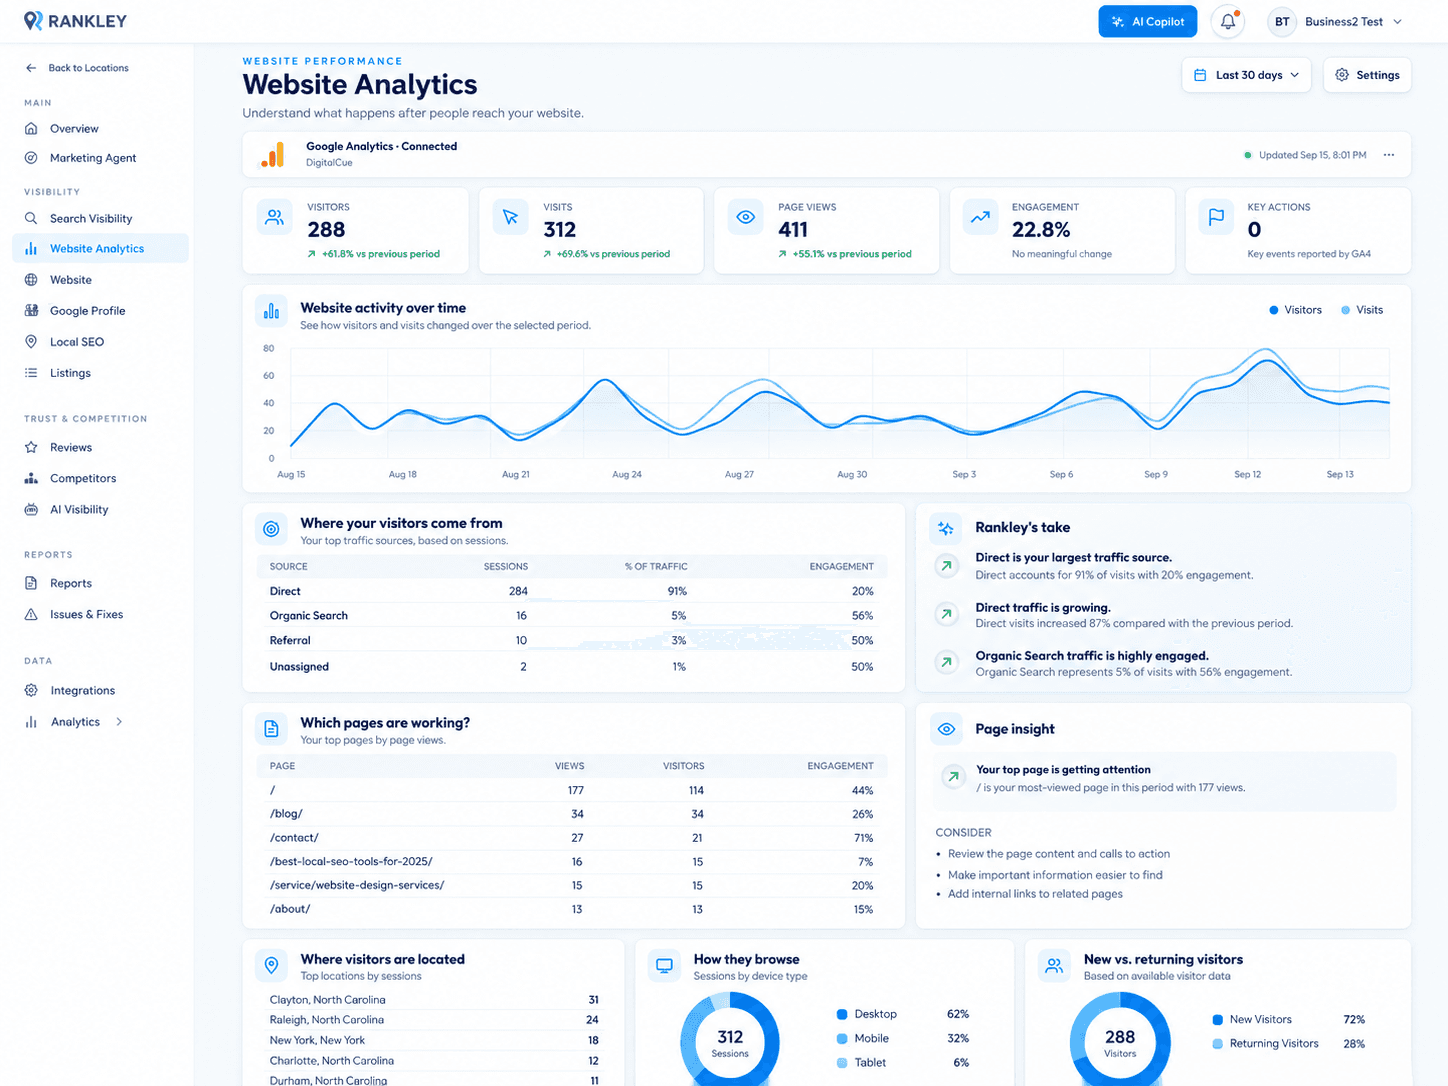
Get a clearer view of your website traffic, engagement, pages, visitor sources, and key actions so you can understand what is working and what may need attention.
VISITORS
288
+61.8%
vs previous period
VISITS
312
+69.6%
vs previous period
PAGE VIEWS
411
+55.1%
vs previous period
ENGAGEMENT
22.8%
No meaningful change
vs previous period
KEY ACTIONS
0
No data reported
Depends on your GA4 setup
See your key website metrics at a glance.
Understand trends and spot meaningful changes.
Go beyond traffic counts with engagement and visitor behavior.
See which website signals may deserve a closer look.

CONNECTED THROUGH GOOGLE ANALYTICS
Rankley connects to your Google Analytics data and brings website performance into a clearer business-facing view.
FROM ANALYTICS TO UNDERSTANDING
Google Analytics shows what is happening on your website. Rankley brings those signals into a clearer business-facing view so you can understand what is working and what may deserve attention.
The data shows what happened
Website traffic over time
Traffic sources
Top pages
The insights explain what it means
Direct is your largest traffic source.
Direct accounts for most visits in this period. This often includes people who type your URL, use a bookmark, or click from emails and offline sources.
Organic Search is highly engaged.
Organic Search represents a smaller share of visits, but visitors from search are showing stronger engagement than the overall site average.
A top page may deserve attention.
A page with meaningful traffic but lower engagement can be a useful place to review content, calls to action, or visitor experience.
Key actions may need setup or review.
If GA4 is not reporting key actions, review whether calls, forms, purchases, or other important outcomes should be tracked.
A clearer view of what to focus on
Direct is your largest traffic source.
Most visits are coming through Direct in this period.
Organic Search is performing well.
Search visitors are showing stronger engagement than the site average.
A high-traffic page may need attention.
Strong page visibility paired with lower engagement can be worth reviewing.
Key actions are not being reported.
Check your GA4 setup if important outcomes should be tracked.
Rankley brings your Google Analytics data into a business-facing view so you can spend less time sorting through reports and more time understanding what deserves attention.
WEBSITE ANALYTICS WORKSPACE
Your connected Google Analytics data, organized into a simple business-facing workspace. See traffic, engagement, top pages, visitor behavior, and key insights without digging through multiple reports.
See visitors, visits, page views, engagement, and key actions for your selected date range.
Track how website traffic and visits change so you can spot trends and opportunities.
See which pages get the most views and how visitors engage with your content.
Quickly change the date range and settings to focus on the data you need.
Understand where your visitors come from, including search, direct, and other sources.
See where your visitors are located, how they browse, and the mix of new vs. returning visitors.
Get the key insights without digging through complex reports.
See what is working and what may need attention.
Learn more about who visits your website and how they behave.
Use real data to guide your next steps.
VISITOR SOURCES
See how visitors find your website, how each source contributes to your traffic, and how engaged those visitors are. Rankley adds plain-language context to help you understand what the data means for your business.
See where your visitors come from and how they engage with your site.
284 visits, 91% of traffic, 20% engagement
0 key actions
16 visits, 5% of traffic, 56% engagement
0 key actions
10 visits, 3% of traffic, 50% engagement
0 key actions
2 visits, 1% of traffic, 50% engagement
0 key actions
See how each channel contributes to your website traffic.
See how engaged visitors are across different sources.
Identify sources that may deserve a closer look.
Use connected traffic data to guide your website strategy.
PAGE PERFORMANCE
See which pages get the most views, how many visitors they attract, and how engaged those visitors are. Rankley adds plain-language context so you can see what is performing well and what may deserve a closer look.
See which pages get the most views and how visitors engage with your content.
/
177 views, 114 visitors, 44% engagement
/blog/
34 views, 34 visitors, 26% engagement
/contact/
27 views, 21 visitors, 71% engagement
/best-local-seo-tools-for-2025/
16 views, 15 visitors, 7% engagement
/service/website-design-services/
15 views, 15 visitors, 20% engagement
Page views
411
+55.1%
vs previous period
Visitors
288
+61.8%
vs previous period
Engagement
22.8%
No meaningful change
vs previous period
See which pages receive the most views and visitors.
See how visitors interact with individual pages.
Identify pages that may deserve a closer look.
Use connected page-performance data to guide your next steps.
VISITOR INSIGHTS
See where visitors are located, how they browse your website, and the mix of new and returning visitors. Rankley brings these signals together so you can better understand your website audience.
See the top locations represented in your website traffic.
See where visits are coming from.
Location data can help you understand which areas are represented in your website traffic during the selected period.
See which device types visitors use to access your website.
Visits
Most visits are on desktop.
Desktop represents the largest share of visits in this reporting period.
See the mix of new and returning visitors in the available visitor data.
Most visitors in this period are new.
New visitors make up 97% of the available visitor mix for this reporting period.
See which locations are represented in your website traffic.
Understand which device types visitors use to access your website.
See the balance between new and returning visitors.
Use connected visitor data to guide your website strategy.
WHAT DESERVES ATTENTION
See the website signals that may be worth a closer look. Rankley brings setup items, page performance, traffic sources, and visitor patterns into one clearer view so you can decide what to review next.
SETUP ITEM
No key actions are reported in the current GA4 data. Review your setup if calls, forms, purchases, or other important outcomes should be tracked.
Why this matters
Tracking important outcomes can help you connect website activity with the actions that matter to your business.
PAGE ENGAGEMENT
A few pages receive meaningful traffic but show lower engagement in this snapshot. These can be useful places to review content, calls to action, or the visitor experience.
ORGANIC SEARCH
Organic Search represents 5% of visits in this period with 56% engagement, higher than the overall site engagement rate.
REFERRAL TRAFFIC
Referral accounts for 3% of visits in this period with 50% engagement.
VISITOR MIX
New visitors make up 97% of the available visitor mix, while returning visitors represent 3%.
See what may need attention in your website data.
Use clearer context to decide what to review next.
Identify areas that may deserve a closer look.
Use website data to support ongoing, informed updates.
CONNECTED BUSINESS CONTEXT
Website Analytics is even more useful when you can view it alongside your other Rankley insights. Together, they give you a clearer, more complete view of your online presence.
Understand your visitors, content, and performance with connected Google Analytics data.

See how your website performs in Google Search, including queries, clicks, impressions, and search trends.
Understand organic discoverySee technical website signals and issues that may affect usability, performance, or search visibility.
Keep your website healthy
See local visibility signals and Google Business Profile performance alongside the rest of your website data.
Understand local visibilitySee how your business appears across supported AI search and answer experiences.
See your AI visibilityCompare your visibility and performance signals with relevant competitors for additional context.
Add competitive contextSee how different visibility and website signals relate to your broader online presence.
See areas that may deserve a closer look across your online presence.
Use connected business context to guide your next steps.
Bring website, search, local, AI, and competitive signals into a clearer view.
HOW WEBSITE ANALYTICS WORKS
Rankley brings connected Google Analytics data into a clearer business-facing workspace. Connect your data, understand website performance, and review the signals that may deserve attention.
Connect Google Analytics to Rankley and choose the GA4 property you want to use for Website Analytics.
Connect your dataSee traffic, engagement, visitor sources, top pages, device usage, locations, and visitor behavior in one clearer business-facing view.
Understand performanceRankley surfaces setup items, page-performance signals, traffic-source context, and visitor patterns that may be worth reviewing.
Review key signalsWEBSITE ANALYTICS FAQ
Answers to common questions about how Rankley Website Analytics works, what data it uses, and how it helps you understand your website performance.
Website Analytics is Rankley's business-facing view of your connected Google Analytics data. It brings website traffic, engagement, page performance, visitor sources, device usage, locations, and other useful signals into a clearer workspace designed for business owners.
Website Analytics uses data from the Google Analytics 4 property you connect to Rankley. The available information can include visitors, visits, page views, engagement, traffic sources, page performance, device usage, locations, and visitor mix.
Yes. Website Analytics currently uses connected Google Analytics 4 data as its website performance source. You connect Google Analytics to Rankley and select the GA4 property you want to use.
No. Google Analytics is the underlying analytics platform and data source. Rankley Website Analytics presents selected GA4 data in a simpler business facing workspace and adds clearer context around traffic, pages, visitor behavior, and signals that may deserve attention.
Key Actions are important outcomes tracked in Google Analytics, such as submitted forms, purchases, calls, or other events a business chooses to measure. If GA4 is not reporting Key Actions, Rankley can show that the tracking setup may be worth reviewing.
Yes. Website Analytics lets you review supported reporting periods so you can look at recent website performance and compare a broader range of activity.
Depending on the data available in your connected GA4 property, Rankley can help you review traffic trends, visitor sources, page performance, engagement, device usage, locations, new versus returning visitors, and setup or performance signals that may deserve a closer look.
Search Visibility focuses on how your business appears and performs in organic search before someone reaches your website. Website Analytics focuses on what happens after visitors arrive, including traffic, engagement, pages, visitor sources, and website behavior.
RELATED FEATURES
Website Analytics helps you understand what happens on your website. Explore related Rankley features for additional search, local, and AI visibility context.
See how your website performs in Google Search, including queries, clicks, impressions, and search trends.
See local visibility and Google Business Profile performance alongside the rest of your Rankley data.
See how your business appears across supported AI search and answer experiences.
READY TO GET MORE FROM YOUR WEBSITE?
Connect Google Analytics to Rankley and see website performance in a clearer business-facing view. Understand what is happening on your site and review the signals that may deserve attention.
Use your Google Analytics data
Connect your selected GA4 property.
See what matters
Traffic, pages, sources, visitors, and more.
Make informed decisions
Use clearer website context to guide your next steps.