On this page▼
- 1. Map Heatmap Density
- What It Is & Why It Matters
- How Rankley Surfaces Heatmap Density
- 2. Review Sentiment & Volume Trends
- What It Is & Why It Matters
- How Rankley Tracks Sentiment
- 3. Page Speed Performance Distribution
- What It Is & Why It Matters
- How Rankley Surfaces Speed Issues
- 4. On-Page SEO Compliance Score
- What It Is & Why It Matters
- How Rankley Scores Compliance
- 5. Business Listing Completeness Score
- What It Is & Why It Matters
- How Rankley Tracks Completeness
- Bonus: Reporting Tips
- Conclusion & Next Steps
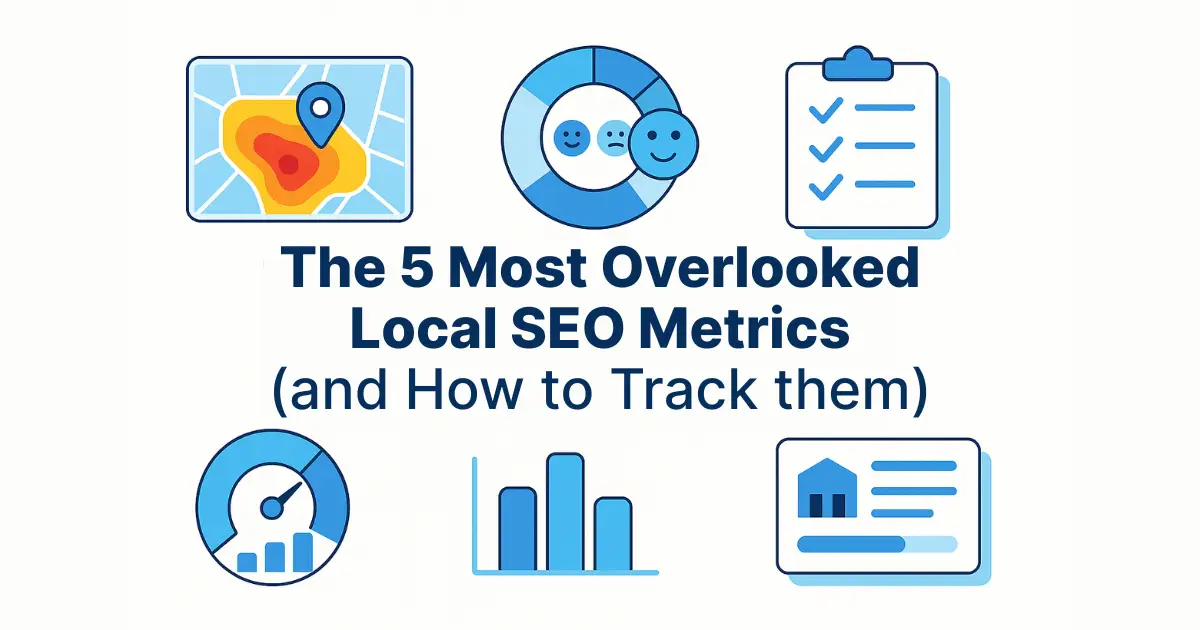
When it comes to dominating local search, most businesses focus on the obvious: keyword rankings, review counts, and citation volume. But savvy marketers know that the real opportunities often hide in subtler signals—metrics that reveal deeper patterns in visibility, performance, and customer perception.
In this post, we’ll uncover five of the most overlooked local SEO metrics and show you exactly how to track each one using Rankley’s AI-powered platform.
1. Map Heatmap Density
What It Is & Why It Matters
Map Heatmap Density visualizes where your business appears in Google’s Local Pack across different geographic areas. Instead of a single rank number, heatmaps reveal pockets of dominance and weakness—making this one of the most actionable overlooked local SEO metrics.
- Shows visibility by neighborhood, ZIP code, or radius
- Highlights underserved service areas
- Guides geo-targeted content and citation efforts
How Rankley Surfaces Heatmap Density
- Open the Map Rankings dashboard
- Select your keyword set
- View a color-coded heatmap overlay
- Filter by radius, keyword, or date range
- Export maps and data as CSV or PDF
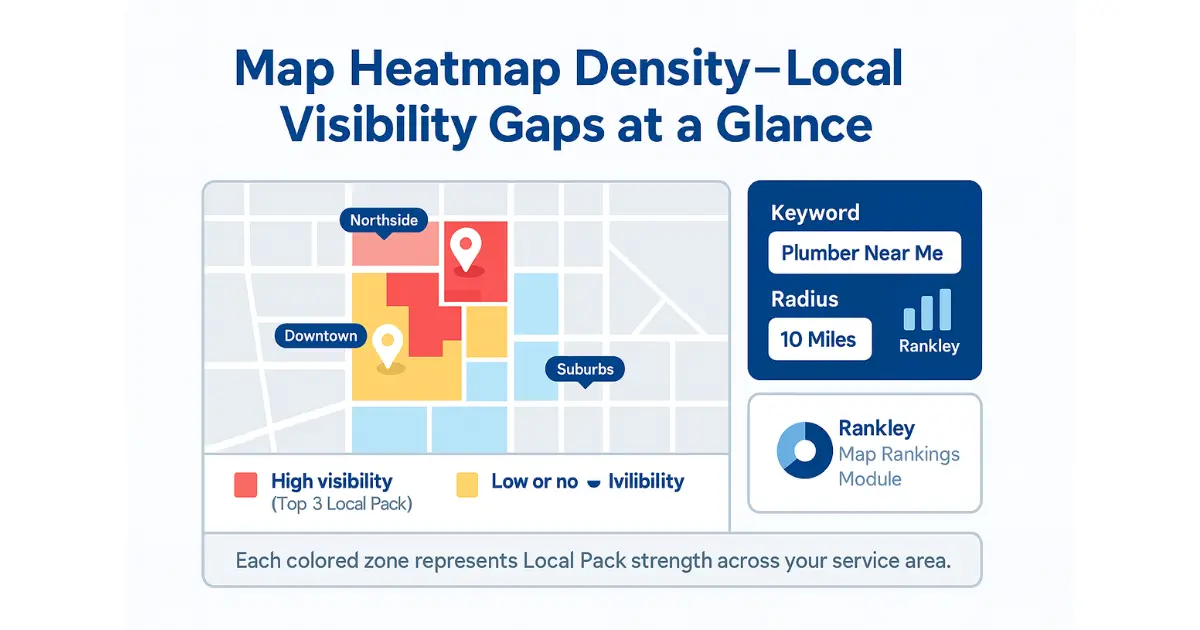
Heatmaps instantly expose where your local visibility is strong—and where competitors are winning.
Benchmark: Top-3 presence in ≥60% of your service area
Leading KPI: % of tiles ranking Top-3
Lagging KPI: Calls and direction requests
2. Review Sentiment & Volume Trends
What It Is & Why It Matters
Review sentiment analysis looks beyond star ratings to understand how customers actually feel. Combined with review velocity, this metric reveals reputation momentum—positive or negative.
- Detects issues before ratings drop
- Identifies service strengths to amplify
- Influences CTR and conversion rates
How Rankley Tracks Sentiment
- Unified review inbox (Google, Yelp, Facebook, more)
- Sentiment donut charts
- Trend lines over time
- AI tags like pricing, speed, professionalism
- Automated alerts when sentiment dips
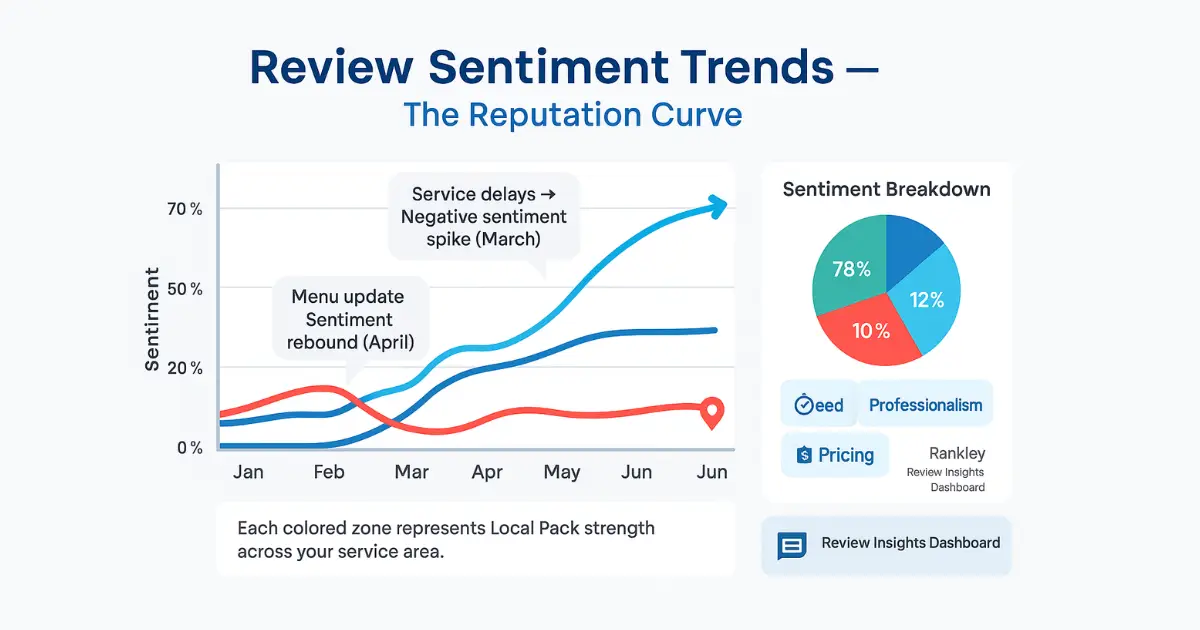
Sentiment trends reveal reputation shifts long before star ratings change.
Benchmark: ≥75% positive sentiment
Leading KPI: Month-over-month sentiment %
Lagging KPI: GBP calls and conversions
3. Page Speed Performance Distribution
What It Is & Why It Matters
Average load time hides problems. Performance distribution shows which pages are dragging your site down—often service and location pages that matter most.
- Targets the slowest 10–20% of pages
- Maximizes Core Web Vitals impact
- Improves UX and conversions
How Rankley Surfaces Speed Issues
- Site-wide speed histogram
- Percentile-based filtering
- CWV breakdown by URL
- AI-generated fix recommendations
- Exportable dev task lists
Benchmark:
- LCP ≤ 2.5s
- CLS < 0.1
Leading KPI: % of pages passing CWV
Lagging KPI: Bounce rate and form submissions
4. On-Page SEO Compliance Score
What It Is & Why It Matters
This score rolls multiple on-page checks into one number:
- Title tags
- Meta descriptions
- H1/H2 structure
- Image alt text
- Internal links
- Structured data
It’s one of the fastest ways to assess whether pages are AI-readable and SEO-complete.
How Rankley Scores Compliance
- Per-URL compliance percentage
- Pass/fail breakdown by element
- AI-prioritized fixes
- Bulk export or task assignment
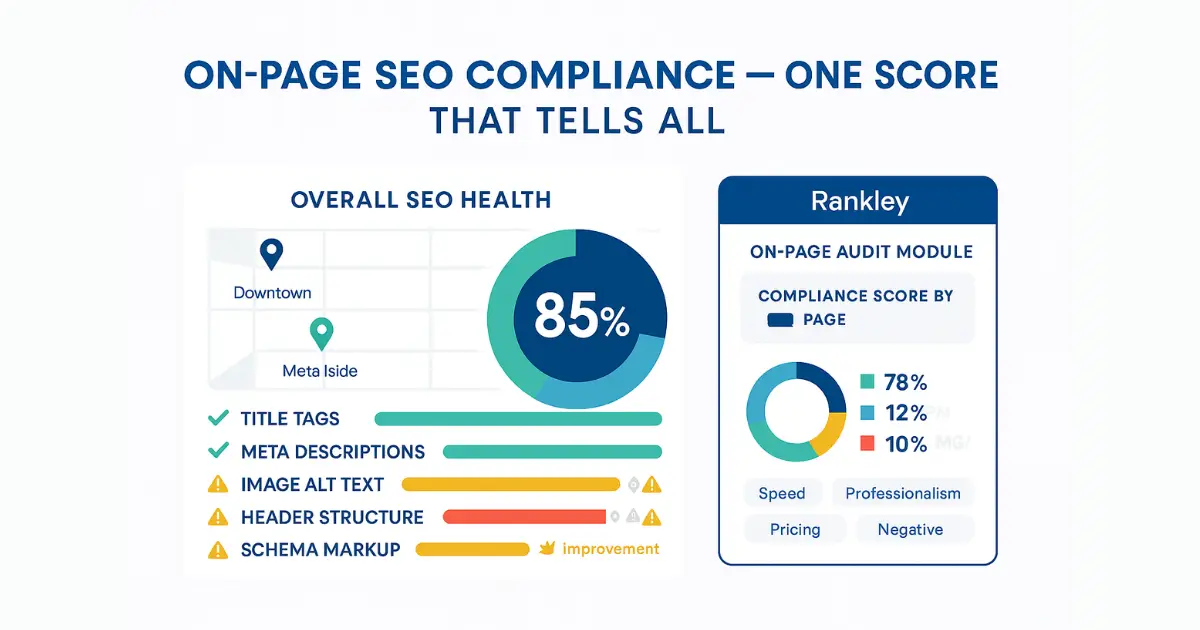
One score that summarizes SEO health and AI-readiness across your site.
Benchmark: ≥90% compliance on service & location pages
Leading KPI: Compliance score
Lagging KPI: Impressions and CTR
5. Business Listing Completeness Score
What It Is & Why It Matters
This metric measures how complete and consistent your business data is across directories like:
- Google Business Profile
- Yelp
- Bing Places
Incomplete or inconsistent listings hurt map visibility and trust.
How Rankley Tracks Completeness
- Overall completeness score
- Directory-by-directory breakdown
- Field-level missing data
- One-click GBP updates
- Scheduled re-audits and alerts
Benchmark: ≥97% completeness
Leading KPI: Completeness by directory
Lagging KPI: Calls and direction requests
Bonus: Reporting Tips
- Combine these metrics into a weekly roll-up dashboard
- Annotate changes with “why this moved” notes
- Track leading vs lagging indicators together
Related reading:
Conclusion & Next Steps
Local SEO success goes far beyond rankings and review counts. By tracking these five overlooked local SEO metrics, you gain a full-picture view of visibility, performance, and trust.
Rankley automates the heavy lifting—turning complex data into clear, prioritized actions.
👉 Ready to uncover your hidden local SEO gaps?
Start your Rankley trial and run your first audit in minutes.